이 과정을 진행한지 한참 지났지만 리마인드를 위해서 정리해본다.
1. 객체 인식 개요
영상인식은 크게 영상 식별(Image classification) 그리고 영상 인식(Image detection) 또는 객체 인식(Object detection)으로 분류되는데,
영상 식별은 특정한 이미지가 개에 가까운지 또는 고양이에 가까운지를 판단하는 것이라면
영상 인식은 이미지 안에 개도 있고 고양이가 있다면 고양이는 어디에 있는지, 개는 어디에 있는지를 판단하는 것이라고 할 수 있다.

어떻게 보면 영상 인식은 영상 식별의 하위 개념으로 볼 수 있는데
rCNN의 원리 또한 입력 이미지를 특정한 알고리즘으로 여러가지 영역(Region)으로 분류한 다음 CNN(합성곱 뉴럴넷)을 적용하여 부분 부분의 이미지를 식별하는 것과 유사하다.
다만 이미지를 잘개 쪼개고 각각에 대해서 CNN알고리즘을 적용하다보면 매우 높은 연산 량이 필요하므로 실시간 처리에 적용하기에는 매우 불리하다.
2. YOLO
실제로 인간의 시각은 들어온 영상에서 영역을 자르고 해당 영역을 식별하는 순서로 처리하지 않는다.
대신 한번에 들어온 전체 이미지에서 특징점을 얻어내고 기존에 학습된 특징점과 비교하여 확률이 높은 영역을 찾는 방식으로 동작한다.
Joseph Redmon, Santosh Divvala, Ross Girshick, Ali Farhadi 은 인간 시각의 이러한 특징에 착안하여 영상 인식을 회귀(Regression)문제로 접근하였다. 그래서 제안된 방법이 YOLO(You Only Look Once)이다.
YOLO는 단일 신경망에서 한번의 예측 단계로 모든 객체를 동시에 탐지하므로 매우 빠르게 동작한다.
논문의 원문은 다음에서 찾을 수 있다.
https://arxiv.org/pdf/1506.02640
그리고 이 논문에서 제안하는 알고리즘은 darknet이라는 이름으로 오픈소스로 공개되었다.
보다 자세한 설명은 다음 링크를 참조하기 바란다.
https://www.datacamp.com/blog/yolo-object-detection-explained
https://youtu.be/69Ii3HjUiTM?si=2RIyr9XaHH-1VS00
2025년 2월 현재 YOLO는 v11까지 발표되었다.
https://docs.ultralytics.com/models/yolo11/
YOLO11 🚀 NEW
Discover YOLO11, the latest advancement in state-of-the-art object detection, offering unmatched accuracy and efficiency for diverse computer vision tasks.
docs.ultralytics.com
본문에서는 YOLOv4를 기준으로 객체 인식하는 과정을 설명한다.
3. YOLO 인식 과정 요약
YOLO 알고리즘이 동작하기 위해서는 다음과 같은 과정이 필요하다.
1. 식별하고자 하는 이미지가 포함된 이미지 셋(Image set)을 준비한다.
2. 이미지셋에서 식별하고자 하는 이미지를 라벨링 한다.
3. 이미지셋을 훈련용과 시험용으로 분류한다.
4. 신경망 네트워크 설정 파일(cfg파일)을 YOLO 버전, 이미지 클래스, GPU사양에 맞게 수정한다.
5. YOLO 버전에 맞는 pre-trained weight함수 파일을 다운로드 한다.
6. darknet을 실행하여 트레이닝을 실행한다. 여기서 final weight 함수 파일이 생성된다.
7. 6에서 생성한 weight 함수 파일과 설정파일을 darknet_ros와 같은 runtime 프레임 워크에 설치한다.
4. 시스템 준비하기
참고로 본 글은 RTX3070이 설치된 ASUS의 Rog Strix Scar G533Z 랩탑에서 수행되었다.
자세한 사양은 다음과 같다.
- CPU: 14-Core Intel i9-12900H
- RAM: 16GB DDR5
- GPU: NVIDIA GeForce RTX 3070 Ti 8GB
- OS: Ubuntu 20.04 LTS
4. 1. darknet 설치
YOLO 알고리즘의 오픈소스 버전은 darknet이라는 이름으로 깃허브에 공개되었다.
본 글은 YOLOv4기준으로 작성된 Alexey의 https://github.com/AlexeyAB/darknet 의 darknet을 fork하여 수정한 버전으로 설치하였다. CUDA 버전12 이후에서 발생하는 오류를 해결한다.
아래 repository에서 다운받으면 된다.
https://github.com/kyuhyong/darknet
GitHub - kyuhyong/darknet: YOLOv4 / Scaled-YOLOv4 / YOLO - Neural Networks for Object Detection (Windows and Linux version of Da
YOLOv4 / Scaled-YOLOv4 / YOLO - Neural Networks for Object Detection (Windows and Linux version of Darknet ) - kyuhyong/darknet
github.com
4. 1. 1. CUDA 설치하기
darknet은 GPU의 성능을 최대한으로 끌어내기 위해 C를 기반으로 CUDA 아키텍쳐를 사용하여 작성되었다.
그런 이유로 darknet을 정상적으로 설치하기 위해서는 n사의 GPU와 함께 CUDA가 설치되어야 한다.
참고로 본 글은 다음 CUDA 버전에서 작성되었다.
$ nvcc --version
nvcc: NVIDIA (R) Cuda compiler driver
Copyright (c) 2005-2023 NVIDIA Corporation
Built on Tue_Jun_13_19:16:58_PDT_2023
Cuda compilation tools, release 12.2, V12.2.91
Build cuda_12.2.r12.2/compiler.32965470_0
CUDA의 자세한 설치 방법은 다음에 설명한다.
4. 1. 2. OpenCV 설치하기
영상 처리를 다루므로 opencv역시 설치되어야 한다.
CUDA를 지원해야 하므로 apt install로 설치하면 안되고 직접 opencv패키지를 다운로드해서 CUDA지원을 활성화한 상태로 cmake 하여 빌드 인스톨한다.
참고로 현재 설치된 opencv 버전은 다음과 같다.
$ pkg-config --modversion opencv
4.8.0
4. 1. 3. Makefile 수정하기
각자의 시스템에 맞춰서 Makefile을 수정한다.
- GPU=1 :CUDA 가속 기능을 켠다(/usr/local/cuda에 설치되어있을 것)
- CUDNN=1 :CUDA의 뉴럴넷 가속 기능(cuDNN)을 켠다(/usr/local/cudnn에 설치되어있을 것)
- CUDNN_HALF=1 : 검출과 트레이닝 속도를 가속하기 위한 Tensor Core를 빌드한다.
- OPENCV=1: 카메라 영상, 비디오 입력을 처리하기 위해 사용한다.
GPU가 지원하는 아키텍쳐에 맞는 ARCH 넘버를 지정한다.
ARCH= -gencode arch=compute_35,code=sm_35 \
      -gencode arch=compute_50,code=[sm_50,compute_50] \
      -gencode arch=compute_52,code=[sm_52,compute_52] \
	  -gencode arch=compute_61,code=[sm_61,compute_61]
터미널에서 darknet 루트 폴더로 이동한 다음 make 명령으로 빌드한다.
5. 이미지셋 만들기
5. 1. 이미지 모으기
darknet 폴더 안에 인식하고자 하는 대상이 포함된 여러 이미지 데이터 폴더를 만든다.
예를 들어 "image_data" 라는 폴더 안에 "images"라는 폴더를 만들고 여러 이미지들을 image_##.jpg 등으로 정리하여 한곳에 넣는다.
폴더 구조는 다음과 같다.
darknet
├── image_data
│   ├── images
|   │   ├── image_1.jpg
│   |   ├── image_2.jpg
|   |   |   ...
│   |   └── image_n.jpg
- 다양한 배경과 조명 환경에서 촬영된 이미지가 필요하다.
5. 2. 이미지 라벨링 하기
이미지에 사각 박스를 그리고 각각의 class를 지정하는 과정이다.
5. 2. 1 프로그램 다운로드
이 작업을 위해 다음 프로그램이 도움이 된다.
https://github.com/HumanSignal/labelImg
GitHub - HumanSignal/labelImg: LabelImg is now part of the Label Studio community. The popular image annotation tool created by
LabelImg is now part of the Label Studio community. The popular image annotation tool created by Tzutalin is no longer actively being developed, but you can check out Label Studio, the open source ...
github.com
5. 2. 2. classes.txt 파일 준비
먼저 앞서 만든 image_data 폴더에 classes.txt 파일을 하나 만들고 각 행마다 class 이름을 입력하고 저장한다.
만약 구별하고자 하는 항목이 clock, toy_car, mouse 라면 classes.txt파일은 다음과 같다.
clock
toy_car
mouse
5.2.1 에서 다운로드한 labelimg 폴더로 이동하여 python3 labelimg.py 를 실행하면 다음과 같은 화면이 나타난다.
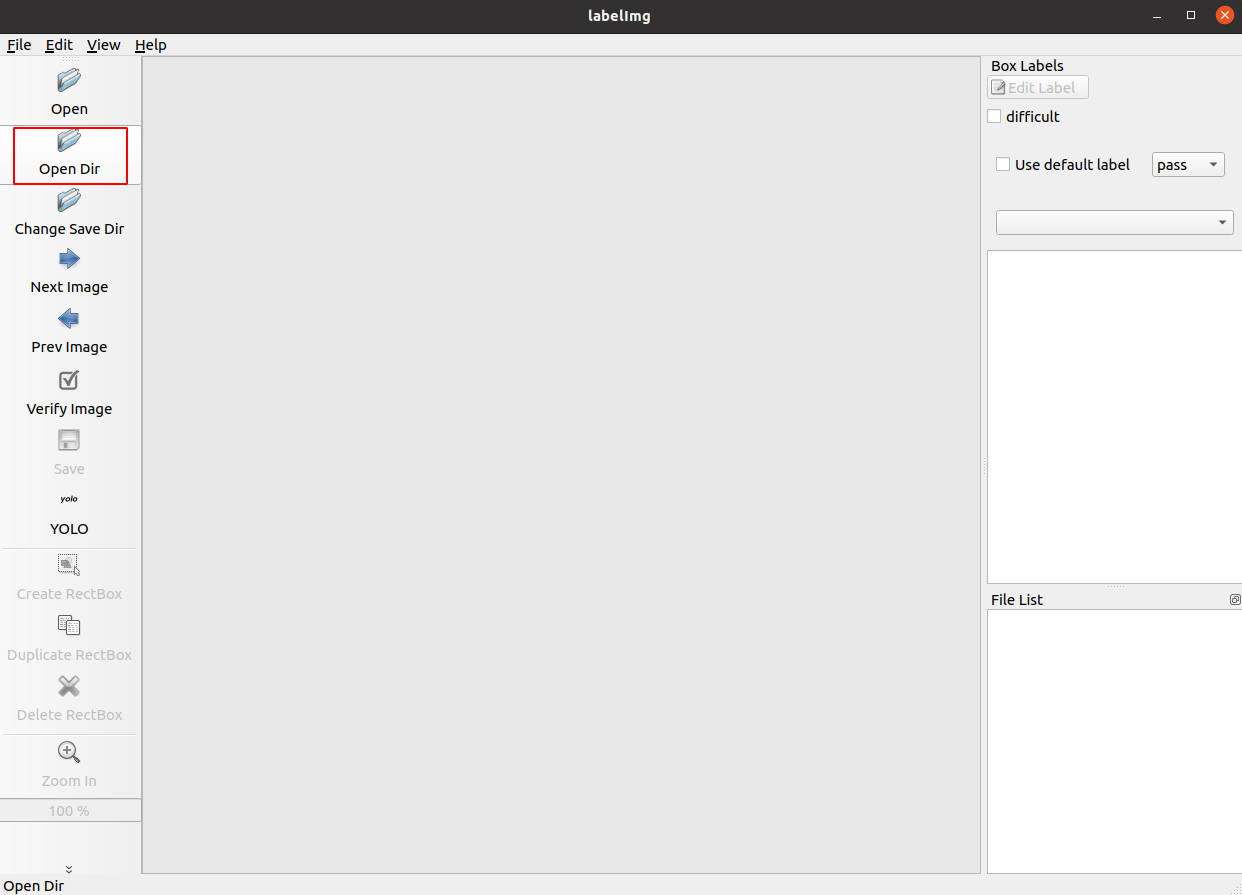
Open Dir을 눌러 위에서 만든 image_data 폴더를 연다.
해당 이미지에서 검출하고자 하는 물체 주변으로 박스를 그린다. 각 박스마다 해당하는 class를 지정한다.
이렇게 하면 각 image_##.jpg 마다 해당되는 class의 위치가 저장된 image_##.txt 파일이 생성된다.
5.3 이미지 분류하기
라벨링된 이미지와 각 이미지의 class위치가 저장된 txt 파일이 모두 얻어졌다면,
해당 파일들을 각각 훈련용 데이터셋과 테스트용 데이터 셋으로 분류하고 각 파일의 경로를 지정해주어야 한다.
Train 데이터와 Test 데이터의 비율은 보통 7:3 정도가 적절하다고 한다.
darknet 폴더에서 다음명령을 실행한다. (이미지 데이터가 image_data폴더인 경우)
python split_images.py image_data
이 프로그램은 자동으로 image_data 안의 images 폴더를 검색하여 train.txt 파일과 test.txt 파일을 생성한다.
이제 폴더 구조가 다음과 같이 변경되었다.
darknet
├── image_data
│   ├── images
|   |   ├── classes.txt
|   |   ├── image_n.jpg
|   |   ├── image_n.txt
|   |   └──
│   ├── test.txt
│   └── train.txt
5. 4. yolo 설정파일 cfg 파일 만들기
image_data/cfg 폴더 안에 사용하고자 하는 YOLO 버전에 맞는 cfg 설정 파일을 만들어야 한다.
yolov4-tiny 버전을 사용할 예정이므로 darknet/cfg 폴더에서 yolov4-tiny.cfg 파일을 복사해서
image_data/cfg 폴더에 넣는다.
인식할 이미지 클래스의 갯수, 사용하는 GPU 메모리등에 따라 수정이 필요하다.
수정할 부분은 다음과 같다. (https://eehoeskrap.tistory.com/370 글 참조)
- batch
- GPU성능에 따라 달라진다.
- 기본 값은 64
- 3070Ti의 경우 4보다 큰 값을 넣으면 실패한다.
- subdivisions
- 배치 사이즈인 64를 얼마나 쪼개서 학습을 할건지에 대한 설정 값
- 기본 값은 8 이지만 Out of memory 에러가 날 경우 16 또는 32 또는 64 로 조절하여 학습을 시도함
- width 및 height
- 기본 값은 416 이지만 608로 변경하여 학습 할 수 있음
- 608로 변경 시 정확도가 좋아질 수 있음
- 입력되는 데이터로부터 다양한 데이터를 학습하기 위한 설정 값
- angle
- augmentation에 관련된 값으로서, 이미지를 - + 몇 도 돌릴 것인지에 대한 설정 값
- 보통 0으로 두거나, 다양한 각도에서 학습하고 싶은 경우 30 ~ 45 정도, 경우에 따라 90도 가능함
- saturation
- augmentation에 관련된 값으로서 이미지에 채도를 추가하고자 할 때 설정하는 값
- exposure
- augmentation에 관련된 값으로서 노출 값을 추가하고자 할 때 설정하는 값
- hue
- augmentation에 관련된 값으로서 색상을 변경하고자 할 때 설정하는 값
- angle
- learning_rate
- 보통 0.001
- multi-gpu 사용 시 학습률을 0.001 / gpu 수 만큼 조절하기도 함
- 예를 들어 GPU 2장을 이용한 학습 시 0.001 / 2 = 0.0005 값을 사용
- burn_in
- 보통 1000
- multi-gpu 사용 시 몇 만큼의 iteration 이 지날 때 마다 학습률을 조정 할 것인지에 대한 값
- multi-gpu 사용 시 1000 * gpu 수 만큼 조절함
- 예를 들어 GPU 2장의 경우 1000 * 2 = 2000 으로 설정
- max_batches
- 언제까지 iteration을 돌건지 설정하는 값
- 보통 class 수 * 2000 으로 설정 (넉넉하게 4000을 곱하는 경우도 있음)
- 1 class 의 경우 (1 * 2000) + 200 = 2200
- 80 class 의 경우 (80 * 2000) + 200 = 160,200
- 뒤에 붙인 200 값은 전 후로 알맞은 가중치를 얻기 위함임
- policy
- 보통 steps
- steps
- 위에서 설정한 max_batches 사이즈(200을 더하지 않은..)의 80% 와 90%를 설정
- 예를 들어 80 class 의 경우 128000,144000 으로 설정
- 위에서 설정한 max_batches 사이즈(200을 더하지 않은..)의 80% 와 90%를 설정
- scales
- 보통 .1,.1
출처: https://eehoeskrap.tistory.com/370 [Enough is not enough:티스토리]
수정한 부분은
batch=4 (GPU의 메모리 용량에 따라 16, 64등 더 큰 숫자를 할 수 있다. 참고로 3070Ti에서는 4보다 크면 실패함)
classes=2
[convolutional]
...
filters=21
...
filters= (4 + 1 + 클래스 수) * 3
참고로 2개의 클래스가 있는 경우의 cfg 파일이다.
[net]
# Testing
#batch=1
#subdivisions=1
# Training
batch=4
subdivisions=1
width=416
height=416
channels=3
momentum=0.9
decay=0.0005
angle=0
saturation = 1.5
exposure = 1.5
hue=.1

learning_rate=0.00261
burn_in=1000

max_batches = 4000
policy=steps
steps=3200,3600
scales=.1,.1


#weights_reject_freq=1001
#ema_alpha=0.9998
#equidistant_point=1000
#num_sigmas_reject_badlabels=3
#badlabels_rejection_percentage=0.2

[convolutional]
batch_normalize=1
filters=32
size=3
stride=2
pad=1
activation=leaky

[convolutional]
batch_normalize=1
filters=64
size=3
stride=2
pad=1
activation=leaky

[convolutional]
batch_normalize=1
filters=64
size=3
stride=1
pad=1
activation=leaky

[route]
layers=-1
groups=2
group_id=1

[convolutional]
batch_normalize=1
filters=32
size=3
stride=1
pad=1
activation=leaky

[convolutional]
batch_normalize=1
filters=32
size=3
stride=1
pad=1
activation=leaky

[route]
layers = -1,-2

[convolutional]
batch_normalize=1
filters=64
size=1
stride=1
pad=1
activation=leaky

[route]
layers = -6,-1

[maxpool]
size=2
stride=2

[convolutional]
batch_normalize=1
filters=128
size=3
stride=1
pad=1
activation=leaky

[route]
layers=-1
groups=2
group_id=1

[convolutional]
batch_normalize=1
filters=64
size=3
stride=1
pad=1
activation=leaky

[convolutional]
batch_normalize=1
filters=64
size=3
stride=1
pad=1
activation=leaky

[route]
layers = -1,-2

[convolutional]
batch_normalize=1
filters=128
size=1
stride=1
pad=1
activation=leaky

[route]
layers = -6,-1

[maxpool]
size=2
stride=2

[convolutional]
batch_normalize=1
filters=256
size=3
stride=1
pad=1
activation=leaky

[route]
layers=-1
groups=2
group_id=1

[convolutional]
batch_normalize=1
filters=128
size=3
stride=1
pad=1
activation=leaky

[convolutional]
batch_normalize=1
filters=128
size=3
stride=1
pad=1
activation=leaky

[route]
layers = -1,-2

[convolutional]
batch_normalize=1
filters=256
size=1
stride=1
pad=1
activation=leaky

[route]
layers = -6,-1

[maxpool]
size=2
stride=2

[convolutional]
batch_normalize=1
filters=512
size=3
stride=1
pad=1
activation=leaky

##################################

[convolutional]
batch_normalize=1
filters=256
size=1
stride=1
pad=1
activation=leaky

[convolutional]
batch_normalize=1
filters=512
size=3
stride=1
pad=1
activation=leaky

[convolutional]
size=1
stride=1
pad=1
filters=21
activation=linear

[yolo]
mask = 3,4,5
anchors = 10,14,  23,27,  37,58,  81,82,  135,169,  344,319
classes=2
num=6
jitter=.3
scale_x_y = 1.05
cls_normalizer=1.0
iou_normalizer=0.07
iou_loss=ciou
ignore_thresh = .7
truth_thresh = 1
random=0
resize=1.5
nms_kind=greedynms
beta_nms=0.6
#new_coords=1
#scale_x_y = 2.0

[route]
layers = -4

[convolutional]
batch_normalize=1
filters=128
size=1
stride=1
pad=1
activation=leaky

[upsample]
stride=2

[route]
layers = -1, 23

[convolutional]
batch_normalize=1
filters=256
size=3
stride=1
pad=1
activation=leaky

[convolutional]
size=1
stride=1
pad=1
filters=21
activation=linear

[yolo]
mask = 1,2,3
anchors = 10,14,  23,27,  37,58,  81,82,  135,169,  344,319
classes=2
num=6
jitter=.3
scale_x_y = 1.05
cls_normalizer=1.0
iou_normalizer=0.07
iou_loss=ciou
ignore_thresh = .7
truth_thresh = 1
random=0
resize=1.5
nms_kind=greedynms
beta_nms=0.6
image_data폴더에 "detector_data.txt"파일을 다음과 같이 만들어준다.
classes=3
train=image_data/train.txt
valid=image_data/test.txt
names=image_data/images/classes.txt
backup=image_data
이제 폴더 구조가 최종적으로 다음과 같이 만들어졌다.
darknet
├── image_data
│   ├── cfg
|   |   └── yolov4-tiny.cfg
│   ├── detector.data
│   ├── images
|   |   ├── classes.txt
|   |   ├── image_n.jpg
|   |   ├── image_n.txt
|   |   └── ...
│   ├── test.txt
│   └── train.txt
5. 5. 기본 weight함수 파일 다운로드 하기
weight함수를 생성하기 위해서는 yolo네트워크에 맞게 기본 설정된 weight함수 파일이 필요하다.
darknet/weight 폴더에 yolov4-tiny.conv.29 를 다운로드 하기 위해 https://github.com/AlexeyAB/darknet/releases/download/darknet_yolo_v4_pre/yolov4-tiny.conv.29 파일을 다운로드한다.
5. 6. 트레이닝 하기
다음과 같이 darknet 명령을 실행하여 weight 함수 파일을 생성한다.
./darknet detector train image_data/detector.data image_data/cfg/yolov4-tiny.cfg weights/yolov4-tiny.conv.29 -map >> log/image_data.log-map 옵션을 주면 훈련 과정이 그래프로 표시된다.
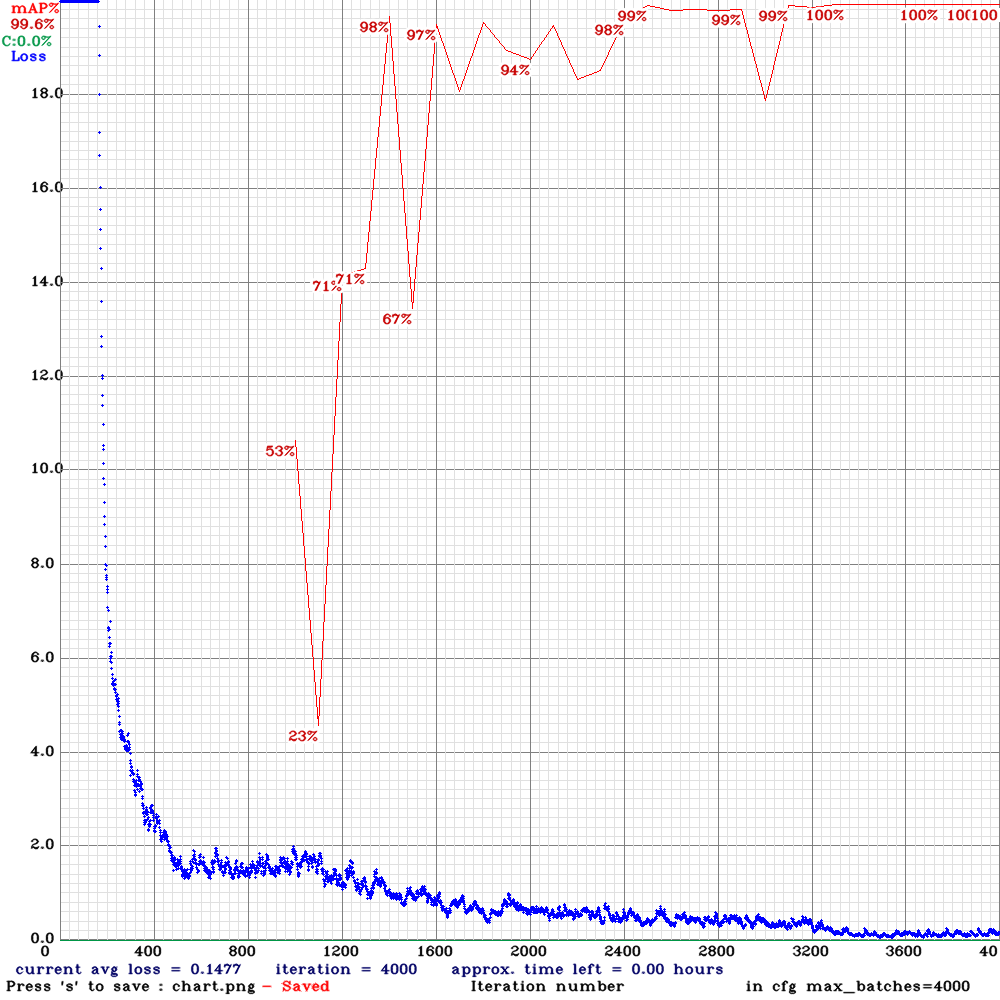
클래스의 갯수, GPU의 성능에 따라 트레이닝이 수행된 후 final weight 파일이 생성된다.
 Tensor Cores are used.
v3 (iou loss, Normalizer: (iou: 0.07, obj: 1.00, cls: 1.00) Region 30 Avg (IOU: 0.803308), count: 14, class_loss = 0.416282, iou_loss = 0.929667, total_loss = 1.345949
v3 (iou loss, Normalizer: (iou: 0.07, obj: 1.00, cls: 1.00) Region 37 Avg (IOU: 0.787318), count: 8, class_loss = 0.853544, iou_loss = 8.100082, total_loss = 8.953627
 total_bbox = 161341, rewritten_bbox = 0.000000 %

 Tensor Cores are used.
v3 (iou loss, Normalizer: (iou: 0.07, obj: 1.00, cls: 1.00) Region 30 Avg (IOU: 0.918996), count: 22, class_loss = 0.001562, iou_loss = 4.227271, total_loss = 4.228833
v3 (iou loss, Normalizer: (iou: 0.07, obj: 1.00, cls: 1.00) Region 37 Avg (IOU: 0.891980), count: 24, class_loss = 0.041704, iou_loss = 6.550589, total_loss = 6.592293
 total_bbox = 161387, rewritten_bbox = 0.000000 %

 Tensor Cores are used.
12Total Detection Time: 0 Seconds
Saving weights to image_data/yolov4-tiny_4000.weights
Saving weights to image_data/yolov4-tiny_last.weights
Saving weights to image_data/yolov4-tiny_final.weights
이제 이 final.weight 파일을 가져다 쓰면 된다.
'ROBOTICS > Artificial Intelligence' 카테고리의 다른 글
| 케라스로 이미지 클래스 분류하기 (0) | 2018.04.14 |
|---|---|
| Theano 설치하기 (0) | 2018.04.11 |
| Ubuntu 16.04 에 Tensorflow 소스로부터 설치하기(GPU from source) (0) | 2018.01.30 |
| Caffe 와 Python을 사용하여 딥러닝으로 개와 고양이 구분하기[3] (0) | 2018.01.24 |
| Caffe 와 Python을 사용하여 딥러닝으로 개와 고양이 구분하기[2] (6) | 2018.01.18 |